After installing Navidrome in your platform, you need to create your
first user. This will be your admin user, a super user that can manage all aspects of Navidrome,
including the ability to manage other users. Just browse to Navidrome’s homepage at
http://localhost:4533 and you will be greeted with a screen like this:
Just fill out the username and password you want to use, confirm the password and click on the
“Create Admin” button.
That’s it! You should now be able to browse and listen to all your music.
Note: It usually take a couple of minutes for
your music to start appearing in Navidrome’s UI. You can check the logs to see what is the scan
progress. If you see any errors, reach out and we can help you
Note: If you have any .m3u playlist in your music folder, they should be added as playlist
in Navidrome automatically. However, Navidrome only does that when there is an admin user. On a
fresh installation, it can happen that Navidrome already finished scanning your music folder
before you created the first admin user. In that case, you need to make sure the “last modified”
date of the m3u files is newer than the last scan. On Linux and macOS systems, this can be
done with the touch command.
Multi-Library Support: If you need to organize multiple music collections (e.g., separating audiobooks from music,
or managing family libraries), check out the Multi-Library documentation to learn how to
set up additional libraries with user-specific access controls.
1 - Anonymous Data Collection
Information on how data is collected by the Navidrome project
Overview
Navidrome includes an anonymous usage statistics feature designed to help improve the project for all users.
This page explains what data is collected, how it is used, and how to opt out if you prefer not to participate.
Key Principles
Anonymous Data Only: Navidrome collects only non-personal, anonymous data to guide future improvements.
What’s NOT Collected: No emails, IP addresses, usernames, or other identifiable data. See Excluded Data.
Opt-Out Available: Enabled by default, but you can disable it anytime.
In-House Data Handling: Collected data goes to an open-source server hosted by the project—no third-party services.
Full Transparency: Logs and UI indicators show when data is sent and what it contains.
What Will Be Collected?
Below is a plain-English explanation of what each field
is generally intended to represent. Each field corresponds to a piece of information about the running application or its environment:
Top-level Fields
InsightsID: A unique, randomly generated identifier for a given Navidrome instance. It’s a random ID that
allows reports from the same instance to be grouped together. It is NOT directly connected to any of your data,
and it cannot be used to directly identify you or your instance.
Version: Shows which Navidrome version each report came from. In aggregate analysis, this tells you how many users are on a
particular version and can highlight upgrade patterns.
Uptime: The amount of time an instance has been running. When aggregated, this helps gauge the overall stability and
average runtime before restarts across the community.
Build Information
Information about custom builds. Aggregated, this can reveal common build configurations used by the community, and if
there are any issues (e.g. performance impact or high memory usage) specific to certain build configurations.
Build.Settings: Key-value pairs representing the compile-time settings for Navidrome (build tags, compiler options, etc.).
Build.GoVersion: The version of Go used to compile Navidrome.
OS Information
OS.Type: Operating system type (e.g., “linux”, “windows”, “darwin”). When aggregated, this shows the distribution of OS usage.
OS.Distro: OS distribution name for Linux-based systems (e.g., “ubuntu”, “debian”). Useful in aggregate form to see which Linux
distributions are most common.
OS.Version: The version of the operating system or distribution. Aggregating these versions helps track environment trends and
legacy OS usage.
OS.Containerized: Whether Navidrome is running in a containerized environment (Docker, Kubernetes, etc..)
OS.Arch: CPU architecture (e.g., “amd64”, “arm”). This allows to understand how Navidrome is typically deployed
(e.g., on Raspberry Pis vs. standard x86 servers).
OS.NumCPU: The number of logical CPUs available. Aggregated, it helps form a picture of typical hardware profiles used across deployments.
Memory Information
Aggregated memory usage helps analyze typical resource consumption patterns and, together with other
metrics, help identify causes for memory leaks.
Mem.Alloc: Current memory allocated by the Go runtime (in bytes).
Mem.TotalAlloc: Memory allocated over the lifetime of the application.
Mem.Sys: Total memory requested from the underlying system.
Mem.NumGC: Number of completed garbage collection runs. Collected in aggregate, this shows a high-level
overview of how Navidrome manages memory across various deployments.
File System Information
Each FS-related field captures information about the directories or storage mediums used by Navidrome. Aggregating this
data can help understand how frequently different types of storage are configured and where media content is commonly stored.
This information is just the type of the filesystem (ex: nfs, ext4, ntfs…) used for each type of storage,
not the actual path.
FS.Music: File system type for storing music files.
FS.Data: File system type storing Navidrome’s database.
FS.Cache: File system type storing cached data.
FS.Backup: The file system type for backups.
Each of these includes Type, describing the kind of storage (e.g., local disk, network mount). Aggregating them
shows how widely different storage setups are used, and their impact on performance.
Library Information
These fields represent aggregate counts of media items and user data within each instance’s library.
Across many deployments, they help illustrate general usage trends of the Navidrome library functionality.
Library.Tracks: Total number of songs (tracks).
Library.Albums: Total number of albums.
Library.Artists: Count of distinct artists.
Library.Playlists: Number of playlists.
Library.Shares: Number of shares (public links).
Library.Radios: The count of radio station entries or streaming sources.
Library.ActiveUsers: Number of currently active users in the last 7 days. This helps understand the average load the server
is operating under.
Library.ActivePlayers: Number of currently active players in the last 7 days. This allows to understand what
are the most used players.
Configuration Settings
These are various Navidrome configuration flags and settings. In aggregate, they help show which features are commonly
enabled or how the service is typically set up across the community. These are mostly boolean flags or simple settings,
NO identifiable data is collected (paths, ids, tokens, etc..). For a reference of what each one represents, take a look at
the configuration options page in the documentation.
Config.LogLevel
Config.LogFileConfigured
Config.TLSConfigured
Config.ScanSchedule
Config.TranscodingCacheSize
Config.ImageCacheSize
Config.EnableArtworkPrecache
Config.EnableDownloads
Config.EnableSharing
Config.EnableStarRating
Config.EnableLastFM
Config.EnableListenBrainz
Config.EnableSpotify
Config.EnableMediaFileCoverArt
Config.EnableJukebox
Config.EnablePrometheus
Config.SessionTimeout
Config.SearchFullString
Config.RecentlyAddedByModTime
Config.PreferSortTags
Config.BackupSchedule
Config.BackupCount
Config.DefaultBackgroundURL
Config.DevActivityPanel
Config.EnableCoverAnimation
In Summary:
When gathered from many Navidrome instances, these metrics and settings are invaluable in understanding the aggregate
patterns of usage, deployment environments, media collections, and configuration preferences. This aggregated data
is not intended for diagnosing single-instance issues; rather, it provides a high-level view of how Navidrome is
deployed and used by its community overall.
To protect your privacy, the following will not be collected:
No Personal Information: No emails, usernames, or anything identifiable.
No Network Information: No IP addresses or device fingerprints.
No Detailed Playback History: Individual song plays are not tied to specific users.
No Library Details: Song/artist/album/playlist names are excluded.
No Sensitive Configuration Data: Passwords, tokens, or logs with personal info are never collected.
Why Collect This Data?
Collecting anonymous usage statistics helps:
Identify popular platforms and configurations.
Prioritize features and fixes based on usage patterns.
Ensure updates don’t unintentionally disrupt the majority of users.
Privacy and Transparency
Transparency Measures
Human-Readable Documentation: This page explains all details in a clear, accessible way.
Log Transparency: Each data submission logs:
The exact payload sent.
The destination URL. Example:
Sent Insights data (for details see http://navidrome.org/docs/getting-started/insights data="{\"id\":\"4c457065-101a-435a-b158-244b573579cd\",\"version\":\"0.53.3-SNAPSHOT (7f47e0a53)\",\"uptime\":0,\"build\":{\"settings\":{\"-buildmode\":\"exe\",\"-compiler\":\"gc\",\"-ldflags\":\"-extldflags '-static -latomic' -w -s -X github.com/navidrome/navidrome/consts.gitSha=7f47e0a53 -X github.com/navidrome/navidrome/consts.gitTag=v0.53.3-SNAPSHOT\",\"-tags\":\"netgo\",\"CGO_ENABLED\":\"1\",\"GOAMD64\":\"v1\",\"GOARCH\":\"amd64\",\"GOOS\":\"linux\",\"vcs\":\"git\",\"vcs.modified\":\"true\",\"vcs.revision\":\"7f47e0a5373d1ea067de8929c828ee0cd85a0795\",\"vcs.time\":\"2024-12-15T02:01:46Z\"},\"goVersion\":\"go1.23.4\"},\"os\":{\"type\":\"linux\",\"distro\":\"qts\",\"version\":\"5.2.2\",\"arch\":\"amd64\",\"numCPU\":4},\"mem\":{\"alloc\":2750544,\"totalAlloc\":9076584,\"sys\":14243080,\"numGC\":4},\"fs\":{\"music\":{\"type\":\"ext2/ext3/ext4\"},\"data\":{\"type\":\"ext2/ext3/ext4\"},\"cache\":{\"type\":\"ext2/ext3/ext4\"},\"backup\":{\"type\":\"ext2/ext3/ext4\"}},\"library\":{\"tracks\":85200,\"albums\":6255,\"artists\":1319,\"playlists\":26,\"shares\":19,\"radios\":7,\"activeUsers\":1},\"config\":{\"logLevel\":\"debug\",\"transcodingCacheSize\":\"100GB\",\"imageCacheSize\":\"50GB\",\"enableArtworkPrecache\":true,\"enableDownloads\":true,\"enableSharing\":true,\"enableStarRating\":true,\"enableLastFM\":true,\"enableListenBrainz\":true,\"enableMediaFileCoverArt\":true,\"enableSpotify\":true,\"enableCoverAnimation\":true,\"sessionTimeout\":\"168h0m0s\",\"recentlyAddedByModTime\":true,\"backupSchedule\":\"5 4 * * *\",\"backupCount\":5,\"devActivityPanel\":true,\"defaultBackgroundURL\":true}}" server="https://insights.navidrome.org/collect" status="200 OK"
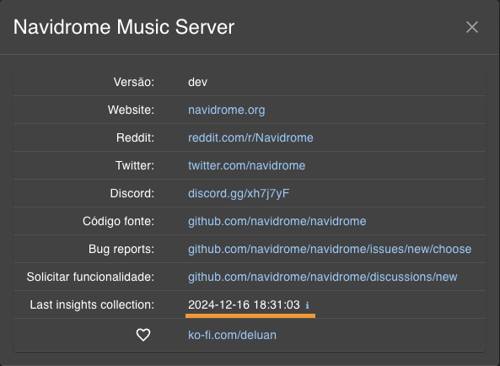
UI Indicator: You will be able to see the last submission date/time in the About dialog:
How to Opt-Out
Data collection is enabled by default, but you can disable it anytime, by setting the new config option
EnableInsightsCollector (or ND_ENABLEINSIGHTSCOLLECTOR env var) to false. If you have EnableExternalServices
set to false, it will also disable the insights collection.
Detailed instructions will be provided in the release notes.
Data Collection Server
The data collection server is open-source and hosted by the Navidrome project, ensuring secure, in-house handling.
Check it out: Navidrome Insights Server.
Thank You for Your Support
By allowing anonymous usage statistics, you’re contributing to the future of Navidrome. Your trust is invaluable,
and if you’re uncomfortable, you can always opt out—no questions asked.
For questions or concerns, feel free to reach out via: